Supervised Learning
In supervised learning, we predict quantities based on other quantities. There are two types of supervised learning tasks, and it’s important to know the difference between those two.
Classification
Classification tasks are tasks such as image classification.
A classification problem is where, given some observations, we have to figure out which class an observation belongs to.
In classification, we are given the observed values and we have to predict the discrete response .
Example: A machine knows what 0 is.
f([0]) => 0
Classification Examples
Examples of classification tasks are:
- We are given a set of numbers, and in that set we have to determine from 0-9 what type of number they are - multi-class classification as you have multiple categories to select from.
- We are given a list of patients, and our task is to check if they have one or more years to live - binary classification as it is binary if they live or not (true/false).
- We are given a short sound signal and have to determine which word is spoken. This is a classification problem, but there are as many classes as there are words (perhaps about 20,000).
- We are given the social Facebook graph for a large group of people and have to determine how likely it is any two random people in the graph will form a friendship (or remain friends) in the next year (binary classification problem as response is discrete, i.e., link/not a link between people).
- We are shown pairs of images of faces and have to determine if the images are of the same person.
Image Classification with Pixels
You can use pixels to do this as shown below:
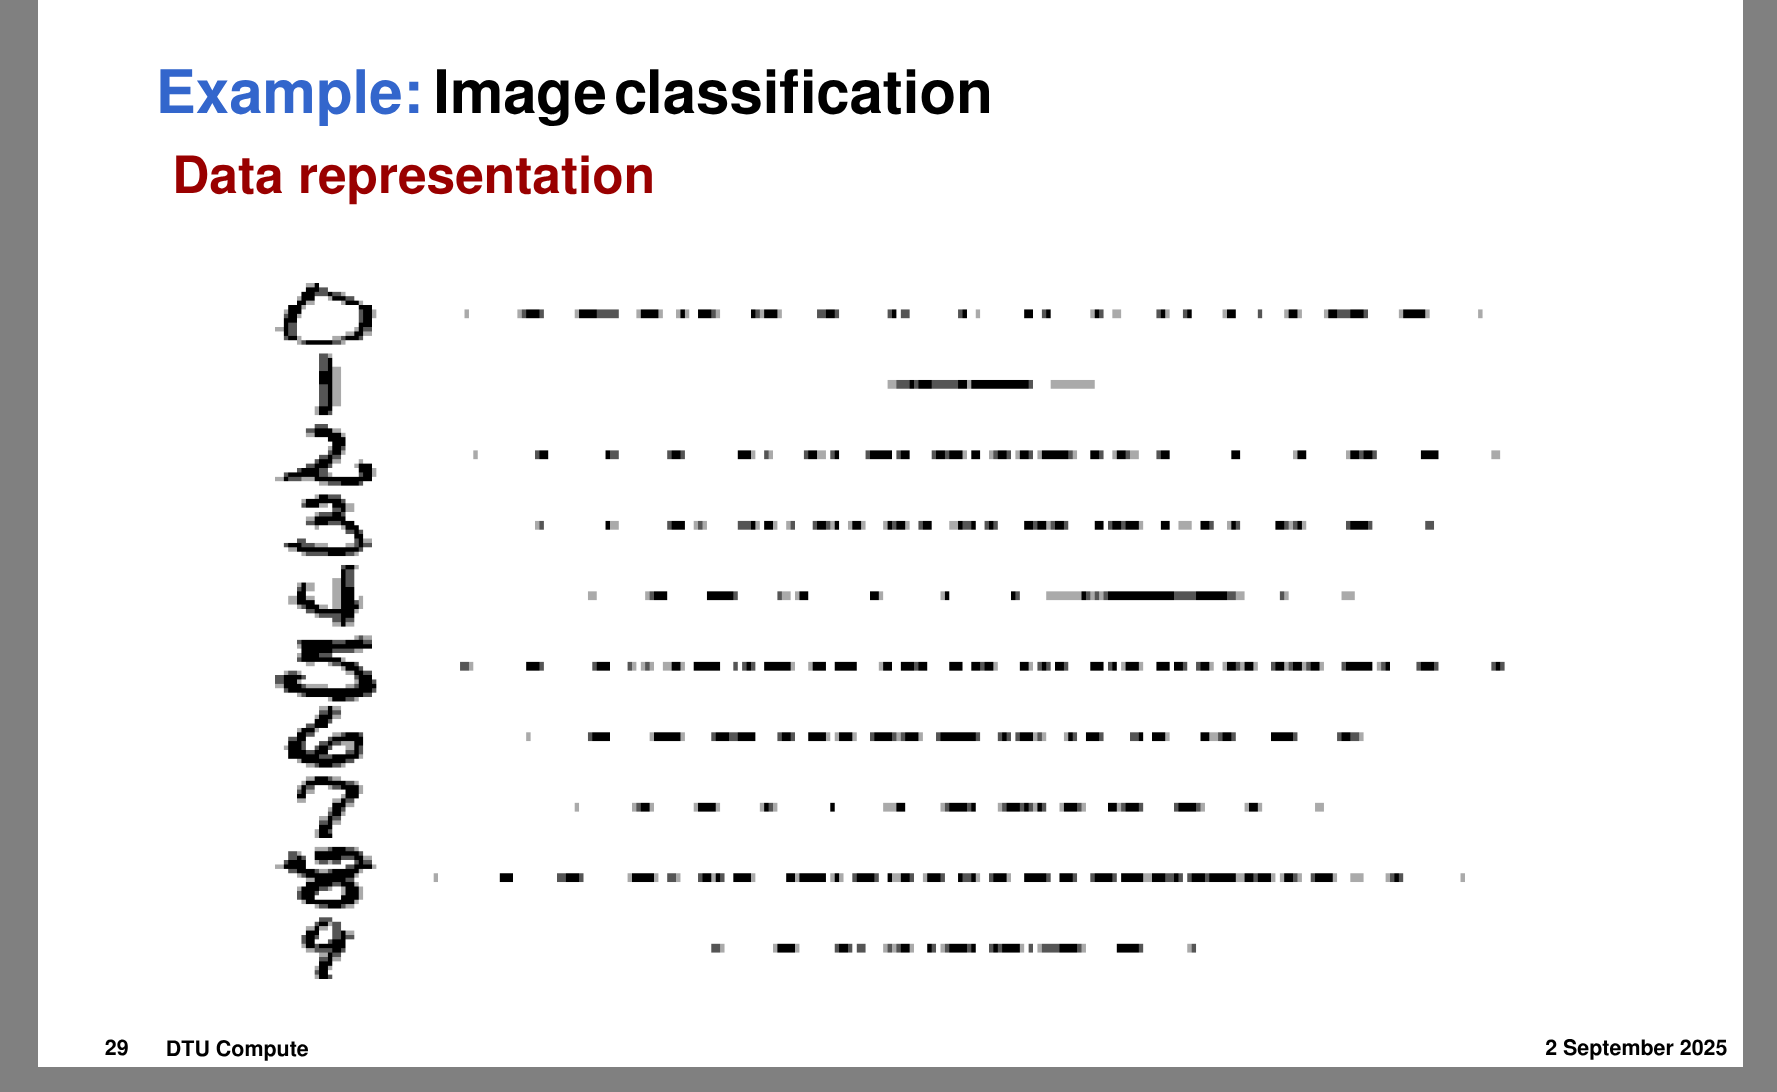
We represent it as a vector in 28 x 28 = 784 vector.
Then, using these points, we want to train an algorithm that can let us classify these numbers.
And then with that, you can find out what number it is, for example.
Regression
Regression is used with multiple data points to find a continuous output.
In regression, we are given observed values and we have to predict the continuous response .
The simplest form of regression is a 1-dimensional regression where we have to predict the values based on the values.
Regression Examples
Examples of regression can be:
- You can do a regression for sales amount or other tasks if we want to predict the future value of those.
- Given historical data of stocks, you have to predict the value of a given stock on Monday (prediction of a single variable).
- We are given a person’s height and have to determine his or her weight (prediction of a single variable from another).
- We are given the performance of all stocks in the past and have to predict the performance of all stocks for the next five days (massive regression problem with many output variables).
- We are given weather information from yesterday and have to predict the temperature in five major cities tomorrow (regression of five variables).
Common Ground
These tasks all seem different, and they are, but they all have a common factor: they map to another observation. A good example is the number one. Given observations of a number, it should map to number 4, for example.
And in the case of regression, the historical data of stocks maps to price prediction of a stock on Monday or multiple stocks.
Supervised learning problems are where we have both observed observations and observed target values. As such, we kind of know the problem and if we solved it correctly, as we know the target value.
This is known as supervised learning problems or simply supervised learning.
Unsupervised Learning - Descriptive Tasks
The opposite of supervised learning is unsupervised learning, where we predict a quantity from other quantities.
This is super useful for tasks where we do not know what is in the data. An example is: let’s say we want to do some machine learning where we predict what animal is in the picture from pictures on the internet.
Here we do not know what image of an animal we have—is it a dog or a cat? Maybe it’s another animal.
We could use a supervised method such as classification to do this and label thousands of images and then determine the type of animal.
But this is a very slow and boring approach.
Unsupervised learning lets us solve problems like this. In unsupervised learning, we take data and try to find labels from the data instead of labeling it ourselves.
Find (human-interpretable) patterns that describe the data.
Clustering
Clustering - Discover group structure in data.
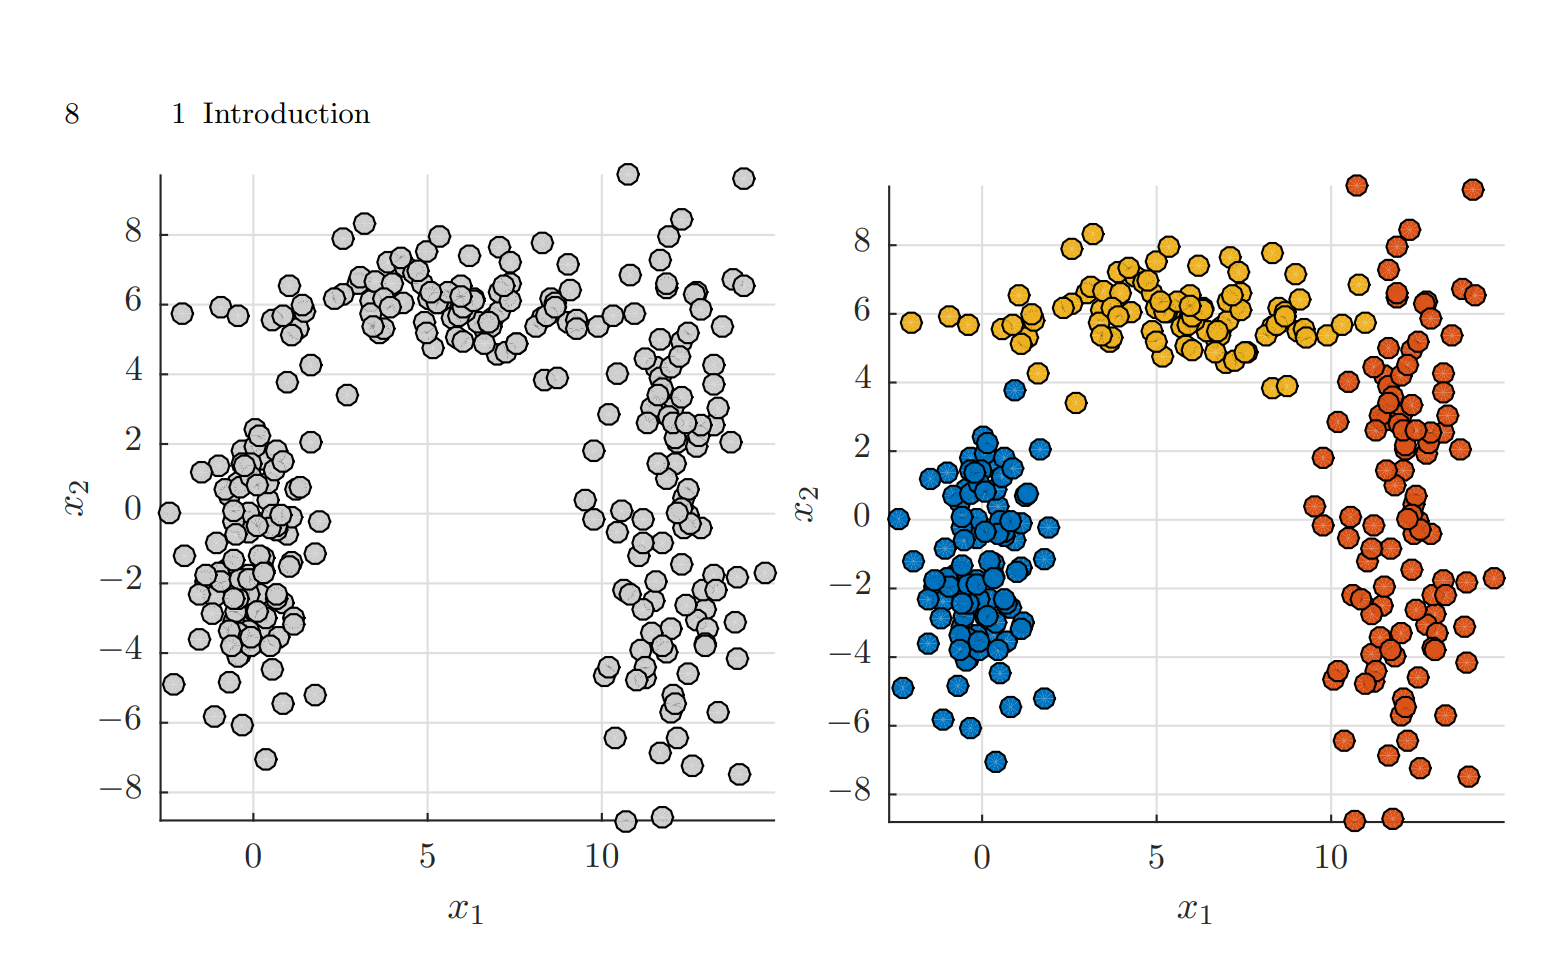
A 2D cluster example shown above. It shows a cluster given a dataset (here the 2D dataset on the left side), and it has to estimate the plausible divisions of the observations into clusters as shown on the right-hand side.
Clustering Examples
Examples of clustering tasks are:
- In the animal example, the goal was to group images into clusters such that each cluster represented a given type of animal.
- Given genetic sequence data from a number of bacteria, try to find natural groupings of the genomes (roughly corresponding to species).
- Given a large collection of documents, try to determine clusters of similar documents corresponding to topics.
So clustering is about classifying data without labeling it and deriving clusters from the data.
Density Estimation
Anomaly Detection (e.g., via density estimation) - Find data objects that are abnormal.
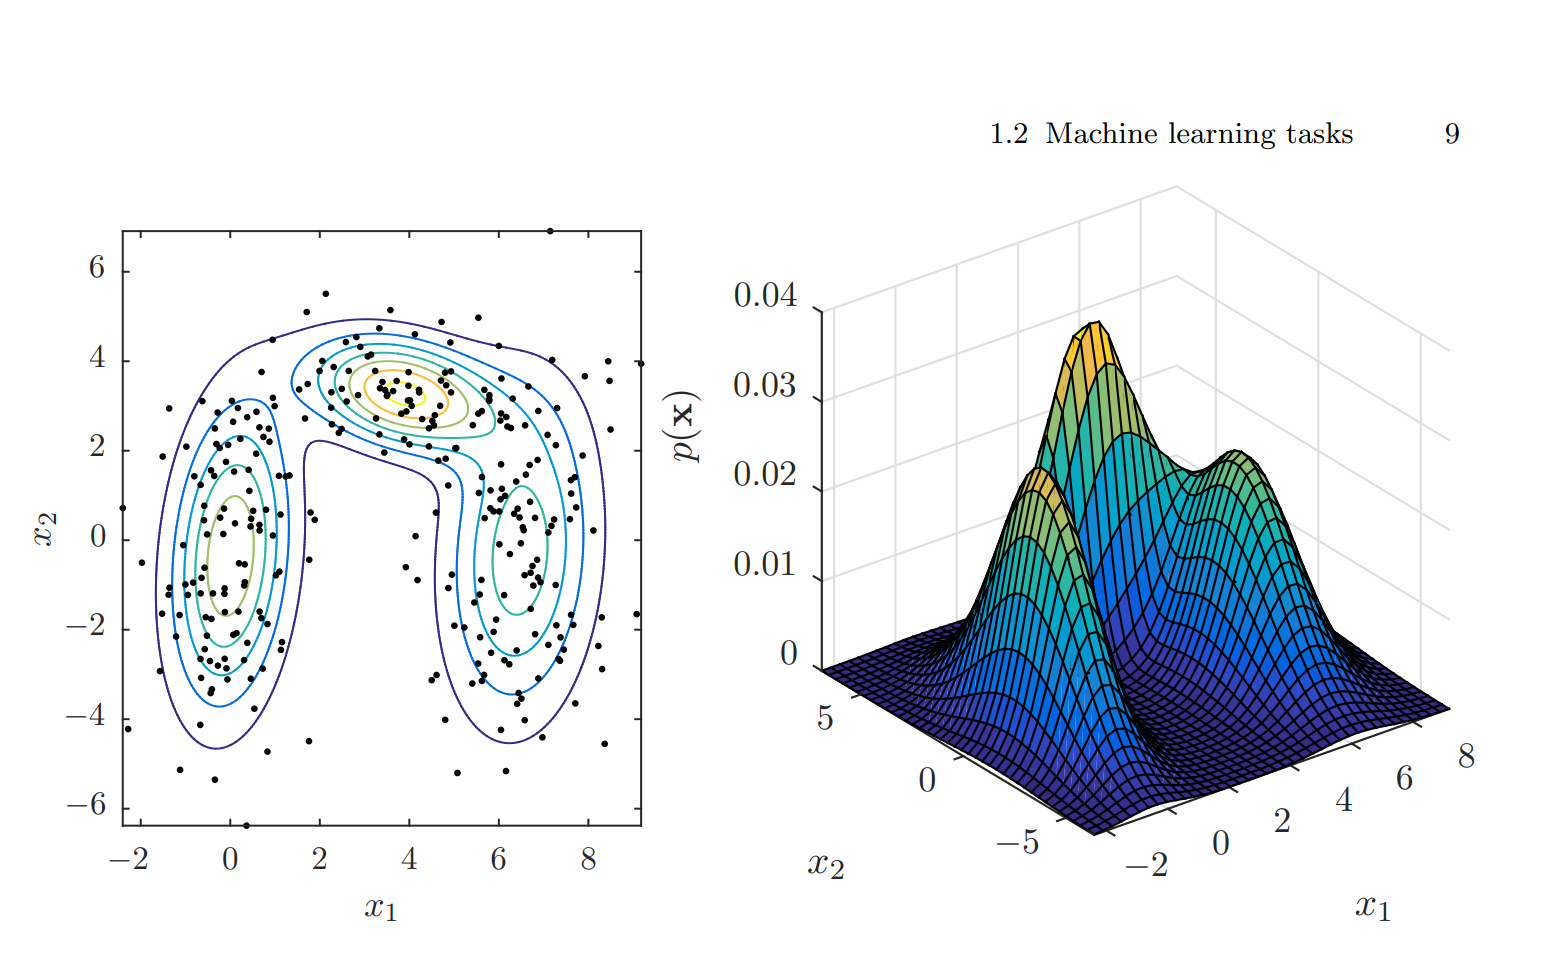
In the above example of 2D density estimation for the digits, using the black points on the left side, the density is estimated and plotted on the right side.
In density estimation, we try to find out how unlikely or likely an outcome is in future observations given the past observations.
The example above can, for example, be used to determine who has written the digits for a given percentage—maybe a fifth of the digits.
Anomaly Detection
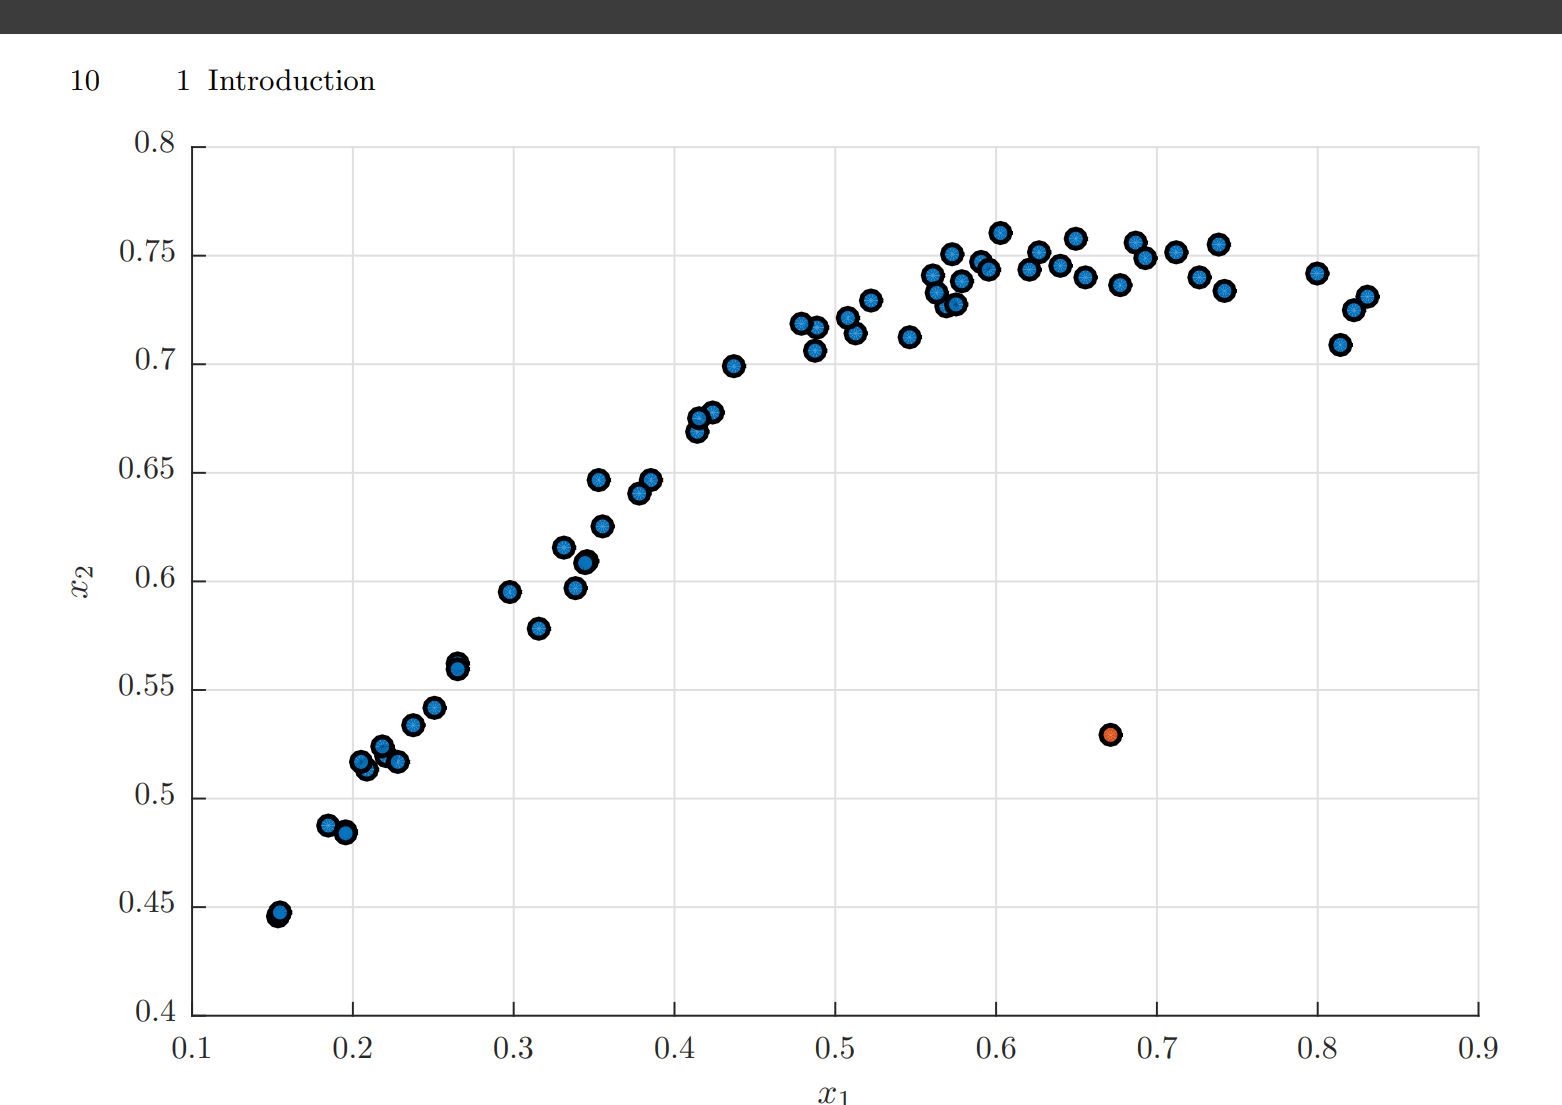
As shown above, anomaly detection allows us to figure out which observation differs more from other observations.
This is done by seeing the distance from an observation’s nearest neighbor. If the distance is too far away, we say that the observation is an anomaly.
Goal is to find abnormal behavior in data and then detect it.
Anomaly detection can be considered closely related to density estimation since an observation which is very implausible (low density) could be considered an outlier. Anomaly detection is relevant in a number of situations including:
- Can be used for detecting credit card fraud and other types of outliers you want to find.
- You supervise a windmill farm and, based on past behavior, have to determine if a windmill is beginning to behave differently, indicating it may require repair.
Association Mining
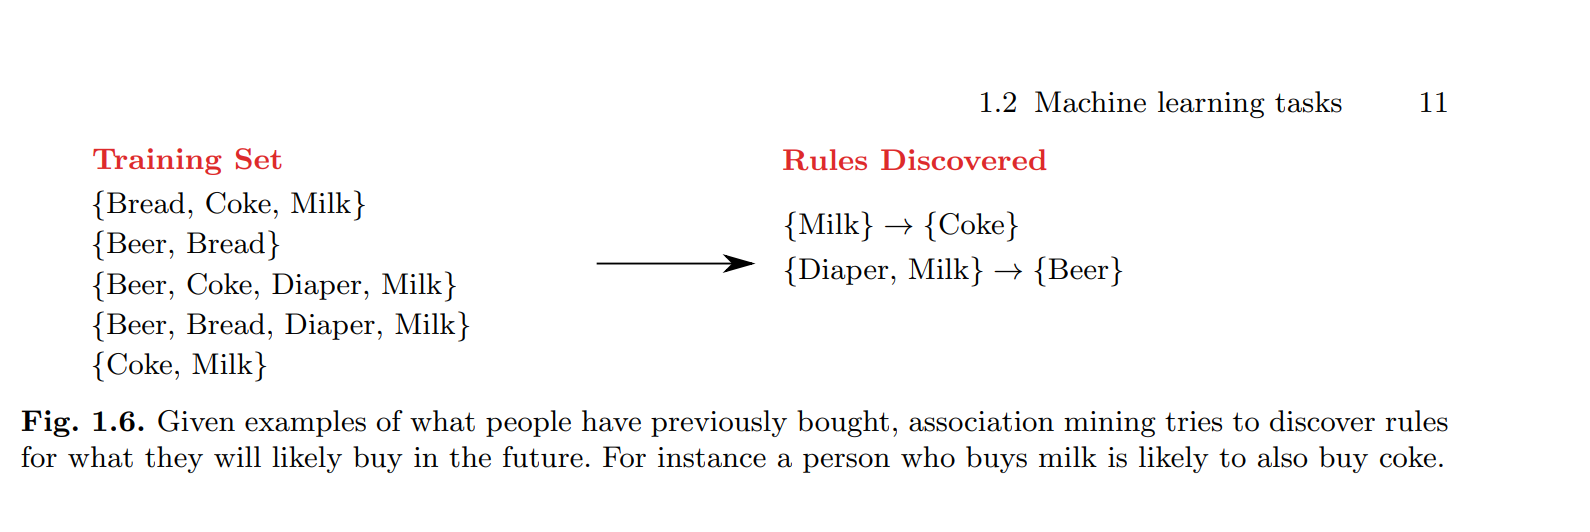
Association mining is about which rules hold up in the dataset.
Rules such as: “If the person bought both book and book , then he is likely to buy book .” This is known as association mining or rule discovery.
Association Mining Examples
Other applications are:
- Given which items people have historically bought in a supermarket, discover what other items each customer is likely interested in.
- Given a number of patients’ medical history, determine which past illnesses and conditions imply high risk for other, future illnesses: “Common cold and operations imply high risk of pneumonia.”
- Given past life experience, figure out that drinking the past night implies hangover.
Reinforcement Learning
Reinforcement learning is when we teach a machine to think by giving it a reward for doing something. We do this by using something called a reward function.
For example, a robot who has to click a button: if it clicks the button, it gets a reward; otherwise, it is given a penalty.
The more you train it using this technique, the better it will be at clicking the correct button.
Representation Learning
Discover the latent representations of the data examples such as next token prediction.
Where you predict the next token.
Models in Machine Learning
Machine learning is about training a system such that it can solve a given problem by learning how to solve it.
The way we make the system do that is by giving it old data and then essentially predicting the future outcome using the past.
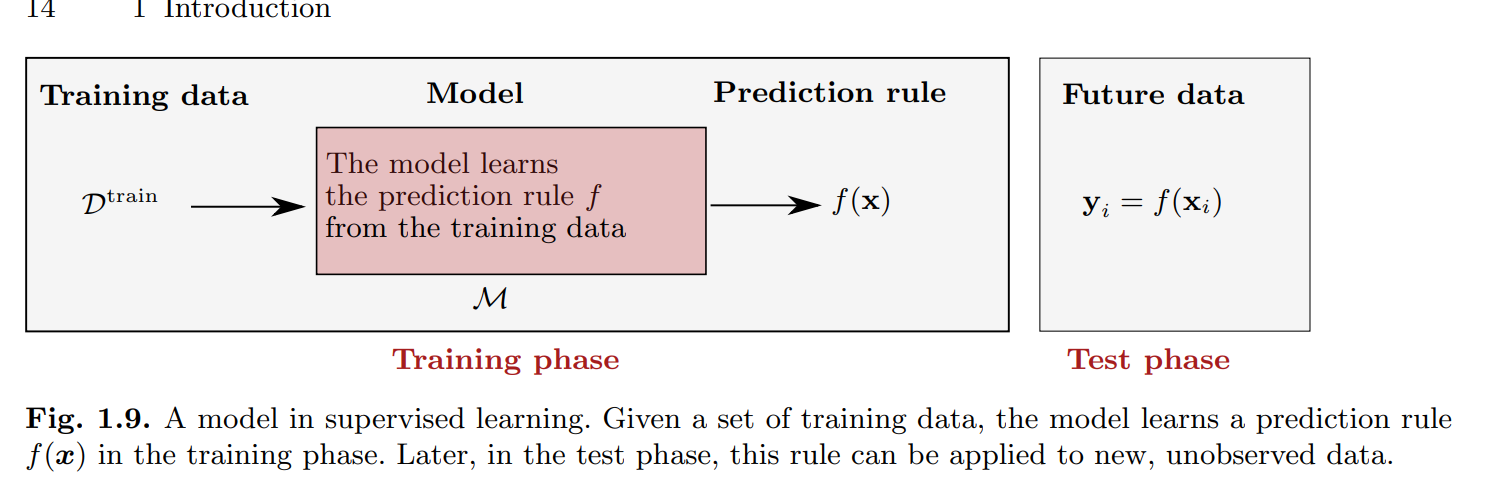
Models in machine learning are functions that take the input and predict the output.
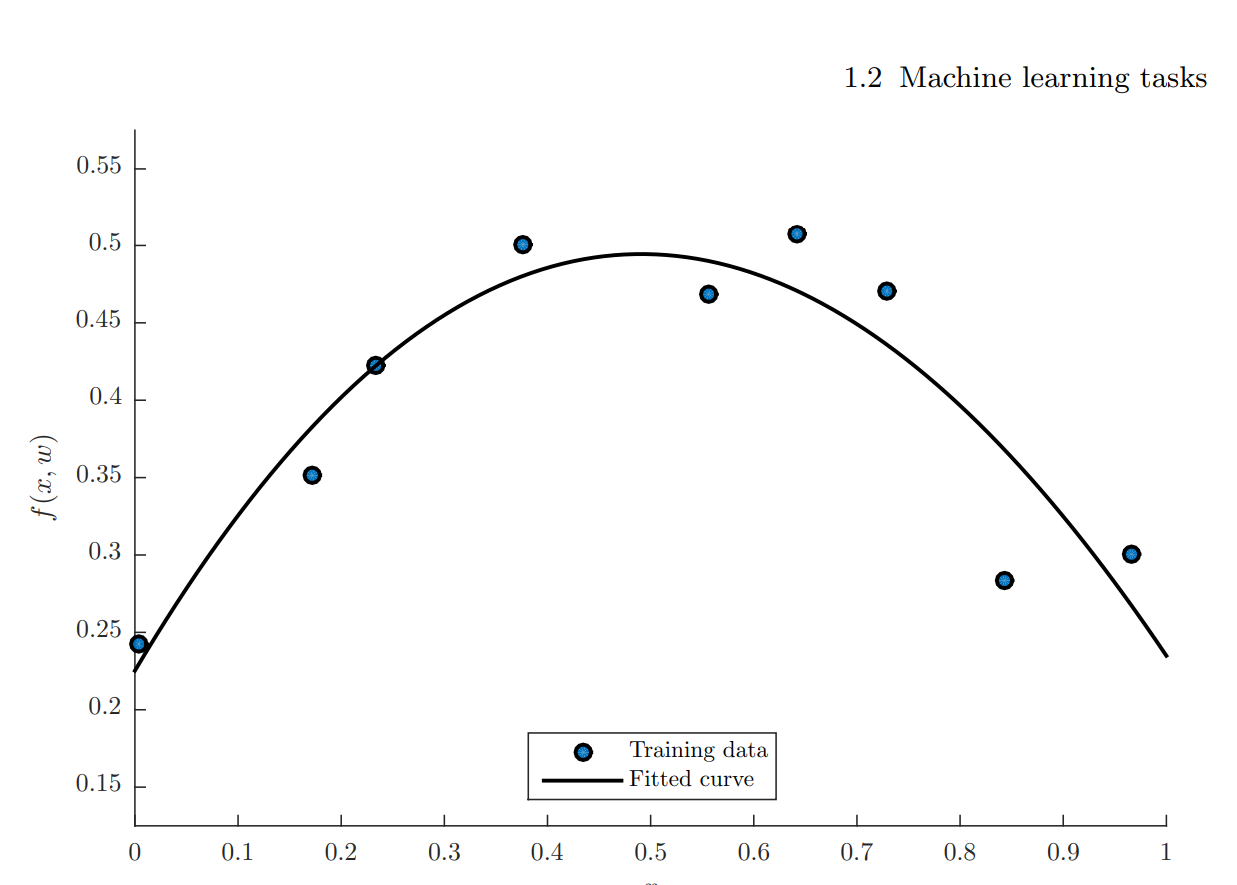
The above example shows that given the set , machine learning then consists of building a program such that takes the training data and returns a function:
The process of learning the function from the training data is known as the training phase.
Again, let’s consider the image example: if , the algorithmic model then predicts if the image contains 5.
Testing and Evaluation
After building our model, we also want to test it. We do that by taking these new observations to see how well the model performs on unseen data.
We call this set , known as the test set. And we can measure this using the . This quantity is key to measuring if a model is good or not. Furthermore, it can tell us if a model is worse than another model.
To be noted, there is also something called a , which is the average error on the training set. These two should not be mixed up.
The above is a real example of how a model works.
Data
The most important thing is to have good quality data.
#TODO
Data has attributes.
Discrete / Continuous Attributes
Discrete Attributes
- Finite (or countable infinite) set of values
- Zip codes
- Counts
- Set of words in a collection of documents
- Often represented as integer values
Continuous Attributes
- Has real numbers as attribute values
- Examples:
- Temperature
- Height
- Weight
- Often represented as floating-point variables
Remember this for report.
Handling Noise in Data
Noise in data is something that makes data unclean and disturbs the data.
You can also define it as unwanted data.
To handle it, you can:
- Exclude noisy attributes
- Remove noise by filter
Focus on what you want to get an answer for.